
RFM Analysis for Fundraising: The Ultimate Guide
Learn about RFM scores, how to calculate them and how using them to segment your donors can improve your campaign performance.
Mohammed Khalil
Founder
What is RFM analysis?
RFM stands for Recency, Frequency, and Monetary Value, each metric representing a significant donor trait. These RFM scores serve as vital indicators of a donor’s behaviour because frequency and monetary value influence a donor’s lifetime value, while recency impacts retention, a measure of engagement.
Why use RFM?
Instead of viewing the entire donor base as one, it’s beneficial to segment donors into similar groups, appreciate the characteristics of each group, and engage them with suitable campaigns rather than just separating by age or location.
With RFM you can easily differentiate between a regular donor who donates £100 a month to another that donated £1,200 at once at the end of each tax year, or easily see how much income your largest donors generate compared to the rest of your donor base.
Calculating RFM scores
We assign a score 1 (best) to 4 (worst) to each donor, for each RFM metric.
- Recency scores are based on how recently a donor has made a donation.
- Frequency scores are based on how often a donor has donated.
- Monetary Value scores are based on the total donated.
All of these metrics are applied to a dataset that spans a fixed time frame (the past 2 years, for example).
Determining RFM score thresholds
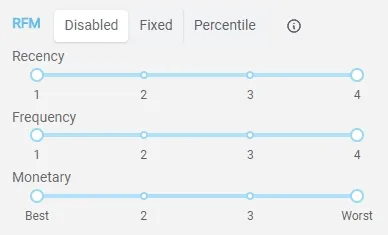
Fixed versus percentile thresholds
We have two options when deciding on how to assign a value to a donor’s behaviour:
- Use fixed intervals, e.g. the M4 group consists of donors that have donated £2,500 or more.
- Use percentile intervals, e.g. M4 group consists of the top 25% of donors by donation value.
Fixed intervals mean you work with a consistent definition of each group from one time period to the next. So comparing the amount of M4 donors one year to the next is very intuitive.
Percentile intervals mean the threshold is constantly changing, depending on the donations in the dataset. So an M4 donor when considering the past 6 months may be an M3 donor if your dataset included a year’s worth of data. The advantage of this method is it’s very easy to select the largest donors over a period, knowing that the group size is not going to be too small, for example.
Determining the thresholds
The thresholds one charity uses may not be useful for another, since the donor base may behave differently. The general idea is to set the thresholds at levels where you have enough granularity, and enough donors in each segment, to achieve your marketing goals. Things to take into consideration:
- If you have a seasonal donation profile then your R thresholds should be set so when you are in a peak giving season, the peak giving season from the previous year is encompassed by one R score. So make R3 10-14 months, rather than 8-12 months, for example.
- Don’t set M1 too low or M4 too high. There is probably little value in cutting off M1 at £10 instead of £20, even if £0-20 donors make up a large percentage of your donors. In reality, you are likely to treat donors that donate £10 or £20 in exactly the same way, so the granularity here is unnecessary. Likewise, setting M4 to £2,500 when you have only 3 donors in this group is not useful.
- None of the intervals need to be equal in size. So when using percentiles, there is no need to make them every 25%.
RFM scoring is part of Giving Analytics’ core features, and here’s what we use by default:
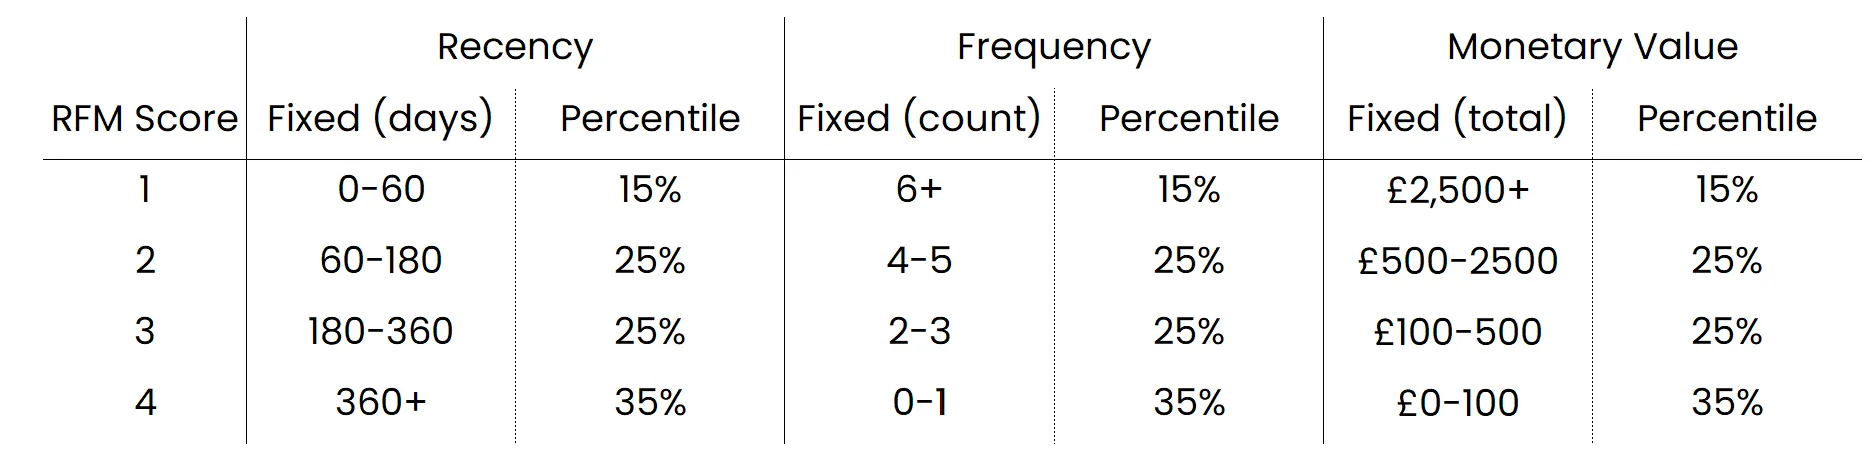
Example: John Smith has donated 3 times over the past 2 years, totaling £560. His most recent donation was 3 months ago.
This donor would be assigned the following RFM scores using the fixed thresholds shown above:
- R = 2, since his last donation was between 60 and 180 days ago.
- F = 3, since he has donated between 2 and 3 times.
- M = 2, since he has donated between £500 and £2,500
John Smith’s RFM score is 2-3-2, and average is 2.33.
Note: Depending on your organisation’s focus, you might adjust the relative importance of each RFM variable to arrive at the overall score, rather than computing the arithmetic average. For example, if you run a disaster relief organisation, frequency of donation might carry more weight due to the urgency of needs. On the other hand, an arts charity might prioritise monetary value due to the high cost of projects.
Making use of RFM scores
Analysing the number of donors in each RFM group allows you to focus your efforts. For example, if the majority of your income comes from M4 donors, it is worth going the extra mile in servicing those donors.
Using different combinations of RFM scores in a filter, you can now determine:
- Who are your most generous donors?
- Who are your most satisfied/engaged donors?
- Which of your donors could contribute to your attrition rate?
- Who has the potential to become significant donors?
- Which of your donors can be retained?
- Which of your donors are most likely to respond to engagement campaigns?
Analysing RFM Segments
Let’s delve into a few interesting segments:
- Heroes (e.g. 1-1-1) are your best donors, who donated most recently, most often, and are significant contributors. Appreciate these donors. They can become ambassadors for your cause and will help promote your organisation.
- Core (e.g. 2-2-2) are your recent donors with average frequency and who gave a good amount. Suggest related causes to motivate them and help them become your Heroes.
- Nurture (e.g. 2-3-2) are your donors who have a high overall RFM score but are not frequent givers. Start building relationships with these donors by providing relevant updates on the appeals they have donated to.
- At Risk (e.g. 3-2-1) are your donors who donated often and significant amounts, but haven’t donated recently. Send them personalised reactivation campaigns to reconnect.
- Almost Lost (e.g. 4-2-2) are donors who used to give quite often, but haven’t been doing so recently. Re-engage them with relevant communications, and conduct surveys to find out what went wrong and avoid losing them to another cause.
What alternatives are there to RFM?
Segmenting your donor base can be done on a variety of other characteristics:
- Demographics
- Geography
- Interests
AI tools can be used to create dynamic clusters of donors based on entire donation histories, demographics and geography based on behaviour patterns not easily discoverable by hand.
There are also some variant RFM models (e.g. to include Engagement, such as email opens), more information on which can be found here.
Conclusion
Data-driven donor segmentation by RFM metrics is a technique that allows charities to quickly identify and segment donors. These groups can be targeted with differentiated and personalised communications, based on the behaviour. With relatively straightforward calculations to determine scores, charities can enhance donor engagement and retention.
Want to apply RFM analysis to your donor base?
Our analytics platform includes built-in RFM scoring and segmentation, so you can start analysing your donors straight away. If you’d prefer expert-led analysis, our data consultancy team can deliver a comprehensive RFM report with tailored recommendations.
On this page